Good planning begins with good research. The direction you set in a strategic plan, a business plan, or a program plan should rest on what you’ve come to know, not just what you’ve come to think. It’s equally true for fundraising campaigns where donors often ask: “why this and why now?” Meaningful answers require data – data that backs up the decisions you make, the strategies you select, and the course you set.
Demographic research underpins the connection between your programs and the populations they are meant to serve. ‘Demography’ is the study of society at a population level – size, composition, and trends over time. Though traditionally a quantitative field, demographic research is most powerful when paired with qualitative methods that uncover the “why” behind the numbers.
This article offers a practical guide to conducting demographic research: what it is and what questions it answers, how to access and use quantitative data, how to complement that data with qualitative methods, and how to translate your findings into strategic decisions.
Understand Who You Serve
Demographic research provides nonprofits with critical intelligence about the communities they serve – and could serve. Done well, it can answer the questions that drive strategy: Who needs our services? Where are they located? Who are we missing? Where do we face competition? What unmet needs can we meet?
What Demographic Research Is. Demographic research goes beyond basic population counts. It examines who lives in a community, how a population is distributed across geography, and how the population is changing over time. It draws on quantitative sources – census figures, administrative records, local planning documents – and pairs the numbers with qualitative data to explain the patterns they reveal. Together, the research builds a living portrait of your community – where it’s been, and where it’s headed.
The Strategic Questions It Answers. The most useful demographic research starts with questions: Who do we currently serve, and who could we serve? Are we reaching populations with the highest need, or the most accessible ones? Where is demand growing, and where is the field already crowded? Data may show that the potential demand for services is growing but may also show a growing number of competitors.
Common Mistakes Organizations Make. ‘Confirmation bias’ is the term used for a common pitfall: conducting research to validate a decision that’s already been made. A related misstep is to study only the populations that seem ‘desirable’ or fundable, while overlooking populations with the greatest need. Another common mistake: collecting data without a clear purpose. Before gathering a single data point, an organization should be able to articulate exactly what decisions this research will inform. Research without that anchor can produce reports and data that only sit on shelves.
Quantitative Research Tools
The quantitative phase of demographic research is about building an evidence base. The good news: most of the data nonprofits need are publicly available and free. The challenge is knowing which sources to use, at what geographic level, and how to interpret what you find.
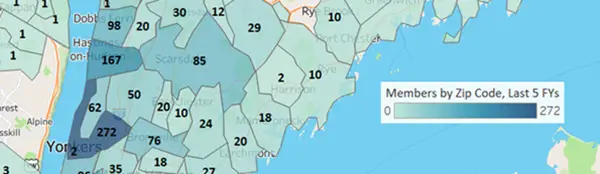
American Community Survey (ACS) Data. The U.S. Census Bureau’s American Community Survey is the richest publicly available source of demographic, social, economic, and housing data at the local level. Information can be found on specific zip codes, or as specific as a single census block group (up to a few hundred people). For most nonprofits, data.census.gov provides access to detailed data tables without need for technical training. Organizations working with larger datasets or that need more control over observation selection may find IPUMS – a researcher-friendly interface to the same underlying data – more useful. One note of caution: ACS estimates for small geographies carry significant margins of error; the more granular the geography, the less precise the data become. Always check the margin of error alongside the estimate and treat small-area comparisons with appropriate skepticism.
Local Planning Documents. Beyond the Census, significant demographic information is embedded in readily available local public planning documents. School district enrollment reports, community board profiles, regional planning commission studies, and municipal comprehensive plans often contain population projections, needs assessments, and service gap analyses that have already been compiled and can speak directly to nonprofit program planning. One especially valuable and underused source: Community Health Needs Assessments (CHNAs), which nonprofit hospitals are federally required to publish every three years. CHNAs typically combine local demographic data, health outcome statistics, community input, and identified service gaps – making them one of the richest sources available for organizations working in health, human services, or community development. These documents are frequently overlooked, and they may contain local nuance that national data sources miss entirely.
Administrative Data Sources. State and city agencies routinely publish administrative data that can be enormously valuable to nonprofits. Education departments publish school-level enrollment and demographic breakdowns. Health departments publish public health indicators and healthcare access statistics by neighborhood. Social services agencies publish caseload data and eligibility estimates. This data varies in accessibility and granularity by jurisdiction, but it tends to be more directly aligned with program-relevant outcomes, and often carries more implicit credibility with government funders.
National Research and Policy Organizations. Think tanks and policy research centers – including Pew Research Cetner, the Urban Institute, the Anne E. Casey Foundation, and the Brookings Institution, among others – publish rigorous, often freely-available research and underlying datasets that nonprofits can access and apply. These sources are most valuable for context within a sector and benchmarking: understanding how your community’s demographic trends compare to national or peer-city patterns, or grounding your case for support in broader evidence about a population or issue area. These are not a substitute for local demographic research: a Pew report on Hispanic household income nationally is an important datapoint but will not illuminate what’s happening in your catchment area. Use these sources to frame the problem and situate your work; use the other sources above to understand your specific community.
Qualitative Methods
Quantitative data tells you what is happening in your community. It can tell you that a neighborhood’s immigrant population has grown, that median household income has declined, or that youth unemployment is rising. What it cannot tell you is the “why” behind those trends; how people experience them; or what a nonprofit can do in response. That’s where qualitative research comes in; it’s essential to a complete understanding of any nonprofit’s landscape.
Stakeholder Interviews. One-on-one interviews with community members, program participants, referral partners, peer organizations, and funders generate insight that no dataset can provide. The key is being deliberate in who you talk to: seek out those whose perspectives are underrepresented in your existing relationships, not just those who are easiest to reach. A well-structured interview protocol, built around open-ended questions that invite narrative rather than yes/no answers, can surface needs, barriers, and opportunities that quantitative data can only hint at.
Community Listening Sessions. Where interviews go deep with individuals, listening sessions go broad across constituent groups. Facilitated sessions with community members, clients, or stakeholders can surface common themes quickly, and signal that the organization genuinely values community voices. Listening sessions work best when participants feel safe speaking honestly, which means investing in skilled facilitation, setting clear norms, and offering sessions easily accessible to those invited. Listening sessions – or “roundtable conversations” in Plan A’s parlance – should generate both data and goodwill; structured documentation makes these into legitimate data-gathering tools.
Bridging Qualitative and Quantitative Findings. The most powerful research combines both methods in dialogue with each other. Numbers can validate what you’ve heard in the field – or reveal that a widely-held assumption is wrong. Qualitative findings can explain patterns in the data that might otherwise seem puzzling. In practice, this means building explicit connections between what your data show and what your community is telling you. Research that triangulates broader trends with local nuance is far more compelling to funders, boards, and partners than either data point alone.
From Data to Decisions
Conducting demographic research is valuable only if it changes how you think and act. Don’t invest in research only to proceed with an unsupported strategy you’ve already planned. The final step in good demographic research – and possibly the most difficult – is translating findings into choices on programs, geographies, partnerships, and resource allocation.
Translate Findings into Strategic Choices. Good research rarely produces a single, obvious answer to a question about strategy; rather, it most often produces a set of trade-offs. Do you double down on your current geography, or expand to where need is growing? Do you redesign programs for a population you’re missing, or deepen impact with the population you already serve? These are decisions that should be made in direct response to what the data show. A useful practice is to bring research findings to a wide range of stakeholders – staff, board, community – for interpretation before setting a strategy. Different constituencies see unique insights in the same data, and diversity in interpretation can be a strong resource.
When Research Suggests Uncomfortable Truths. Sometimes the data tell you something you don’t really want to hear: that the neighborhood you’ve served for decades has changed in ways that challenge your current model; that a competitor is better positioned to serve the population you’ve prioritized; that the program you’re most proud of reaches a fraction of the people who need it most. The organizations that handle this well will treat uncomfortable findings as strategic gifts; early intelligence that allows them to adapt before a crisis forces them to.
Building Ongoing Research Capacity. Demographic research shouldn’t be a one-time project triggered by a planning cycle. Organizations that use data most effectively build it into their regular rhythm: monitoring ACS releases, tracking local planning developments, conducting stakeholder check-ins before major program decisions. This doesn’t require a dedicated research department – it requires a few staff with this designated responsibility, a set of data sources you’ve already learned to navigate, and an agreement that strategic decisions come with evidence attached. Over time, that attentiveness becomes a competitive advantage.